Monitor BESS Performance and Easily Share Insights with Role-Based Storage Dashboards
Battery energy storage systems generate huge amounts of data, but turning that data into useful insights for different stakeholders is still a challenge. With role-based Storage Dashboards, you can deliver the right insights to the right people without manual work.
.webp)
The Challenge: Too Much Data, Not Enough Actionable Insight
In our most recent BESS Pros Survey, the scale of the problem became clear:
- 47% said “developing or maintaining dashboards, tools or data pipelines” takes significant effort
- 41% said “preparing reports for internal or external stakeholders” is one of the most time-consuming tasks
- 75% of asset owners use more than one tool to manage their BESS assets
Teams need to bring together insights from multiple systems like SCADA, EMS, internal tools or spreadsheets. Turning this data into a clear, shareable view of performance takes time.
At the same time, BESS projects involve a wide range of stakeholders:
- Operations and engineering teams monitoring and optimizing system performance
- Asset managers responsible for availability, risk and financial performance
- Executives, investors and lenders who need clear, high-level summaries
- External partners such as O&M providers, suppliers, insurers or financing partners
Each of these groups needs different insights, at different levels of detail and at different frequencies, from real-time operational insights to monthly availability reports or quarterly reporting that go to investors and O&M partners.
Meeting those obligations manually by pulling data from multiple systems, formatting it, and making sure that it's accurate takes hours that could be spent instead on operations.
The result is a constant reporting burden that slows teams down.
The Solution: The Right Insights for Every Stakeholder
With TWAICE’s new Storage Dashboards, you can create tailored dashboards for every stakeholder and share them instantly.
Instead of compiling static views, users can:
- Configure custom dashboards for different stakeholder groups
- Define views based on the exact KPIs and insights needed
- Access always up-to-date, live data directly within the platform
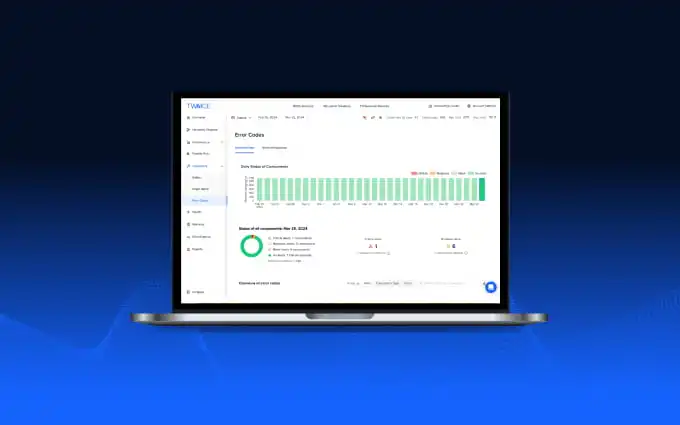
Because dashboards are continuously updated, they provide a real-time view of system performance. Users can monitor their assets more efficiently and quickly identify when deeper investigation is required. From the dashboard, users can move directly into detailed views to investigate trends, diagnose issues and understand root causes.
This makes it easy to provide consistent, transparent insights across your entire stakeholder ecosystem, without reconciling data from multiple sources.
Built for BESS, not generic BI
Unlike generic BI tools, TWAICE’s dashboards are built directly on top of battery-specific analytics. This means:
- No need to build data pipelines or define KPIs from scratch
- Access battery-specific metrics like usable energy, availability, imbalances and more
- Direct connection to advanced analytics and root-cause insights
Designed for every stakeholder
Storage Dashboards allow you to tailor insights to different roles:
- Operations teams get real-time visibility into system status, alerts and required actions
- Asset managers track availability, risks and contractual KPIs.
- Performance engineers can monitor system behavior and quickly investigate issues
- Executives and investors can receive high-level summaries they can trust
This ensures everyone has access to the information they need but without having to prepare it manually each time.
From Deep Analysis to Shareable Insights
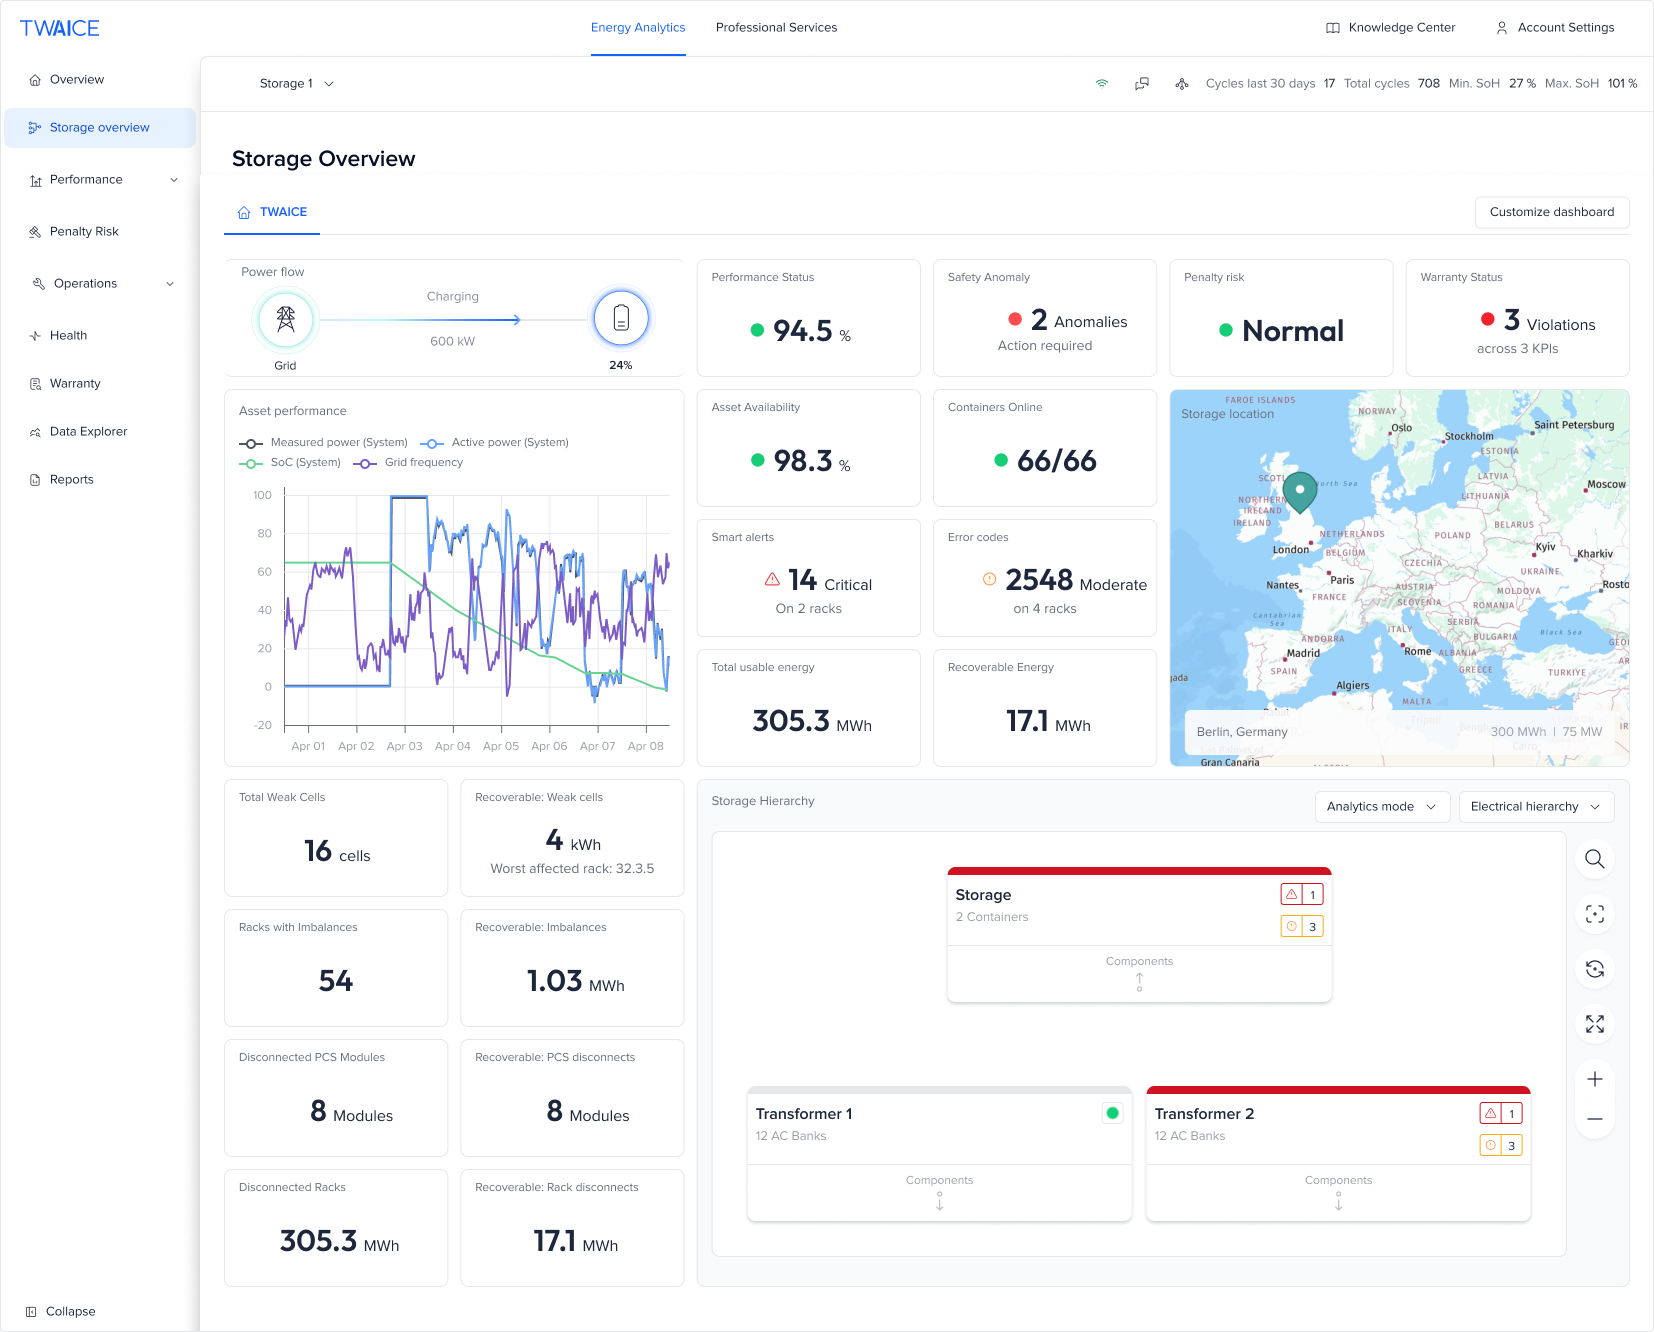
Storage Dashboards combine flexibility with the full power of the TWAICE platform
Users can include:
- Key performance indicators (KPIs): Select from a wide range of BESS-specific metrics
- Power flow visualizations: understand charge / discharge status in real-time
- Map views: Get a quick overview of asset locations
- Saved Data Explorer views: View previously created analyses by adding their charts directly to the dashboard (e.g. a custom investigation of temperature trends or imbalances)
- Custom visuals and images: Add context, branding, or site-specific information
This bridges the gap between technical BESS performance and decision-making.
Less reporting, more action
For many BESS operators, reporting is still a manual, time-consuming process. Storage dashboards change that. By making insights instantly accessible, teams can:
- Save time on manual data preparation
- Improve collaboration across teams and stakeholders
- Make faster, more informed decisions
- Confidently communicate performance and risks with external partners
- Instead of spending hours preparing reports, teams can focus on improving availability, reducing risk, and maximizing the value of their BESS
Talk to our team and learn more about how you can save time with configurable storage dashboards.
Sign up for the next live group demo and learn how TWAICE can transform your BESS operations. In just 30 minutes, you’ll get a demo of key features and use cases, and engage with our product experts for a live Q&A.
.webp)