Speed Up Root Cause Analysis of BESS Issues
TWAICE Energy Storage Analytics is a data analytics software for BESS operations, helping asset managers and performance engineers improve the lifetime, health and safety of their assets. Its features and data visualizations make it easy to pinpoint issues and detect operational risks, but to truly get to the bottom of what is happening, performance engineers must be able to easily access and analyze time-series data. That’s why we built Data Explorer.
The Challenge: Investigating What’s Happening Inside Your BESS Is a Headache
Battery Energy Storage Systems (BESS) generate billions of data points every day. With so much data, investigating issues becomes incredibly complex. Tools like Excel or Grafana often fall short. They require days of manual setup to even begin finding the signals you need, and they may not be able to handle the volume of BESS data.
This challenge is magnified when you compare BESS to other assets like wind or solar. As shown in the chart below, a 100 MW BESS installation produces up to100x more data than a similar-sized PV plant (based on internal analysis). Even experienced energy companies might find themselves overwhelmed by the sensor density, sampling rates, and raw volume of BESS data.

Furthermore, in a recent TWAICE survey, 34% of respondents cited “data management and integration” as one of their top two challenges, along performance, safety and warranty issues. This underscores the need for specialized tools to handle the complexity of BESS time-series data.
The Solution: Visualize and Analyze Time-Series Data In Seconds
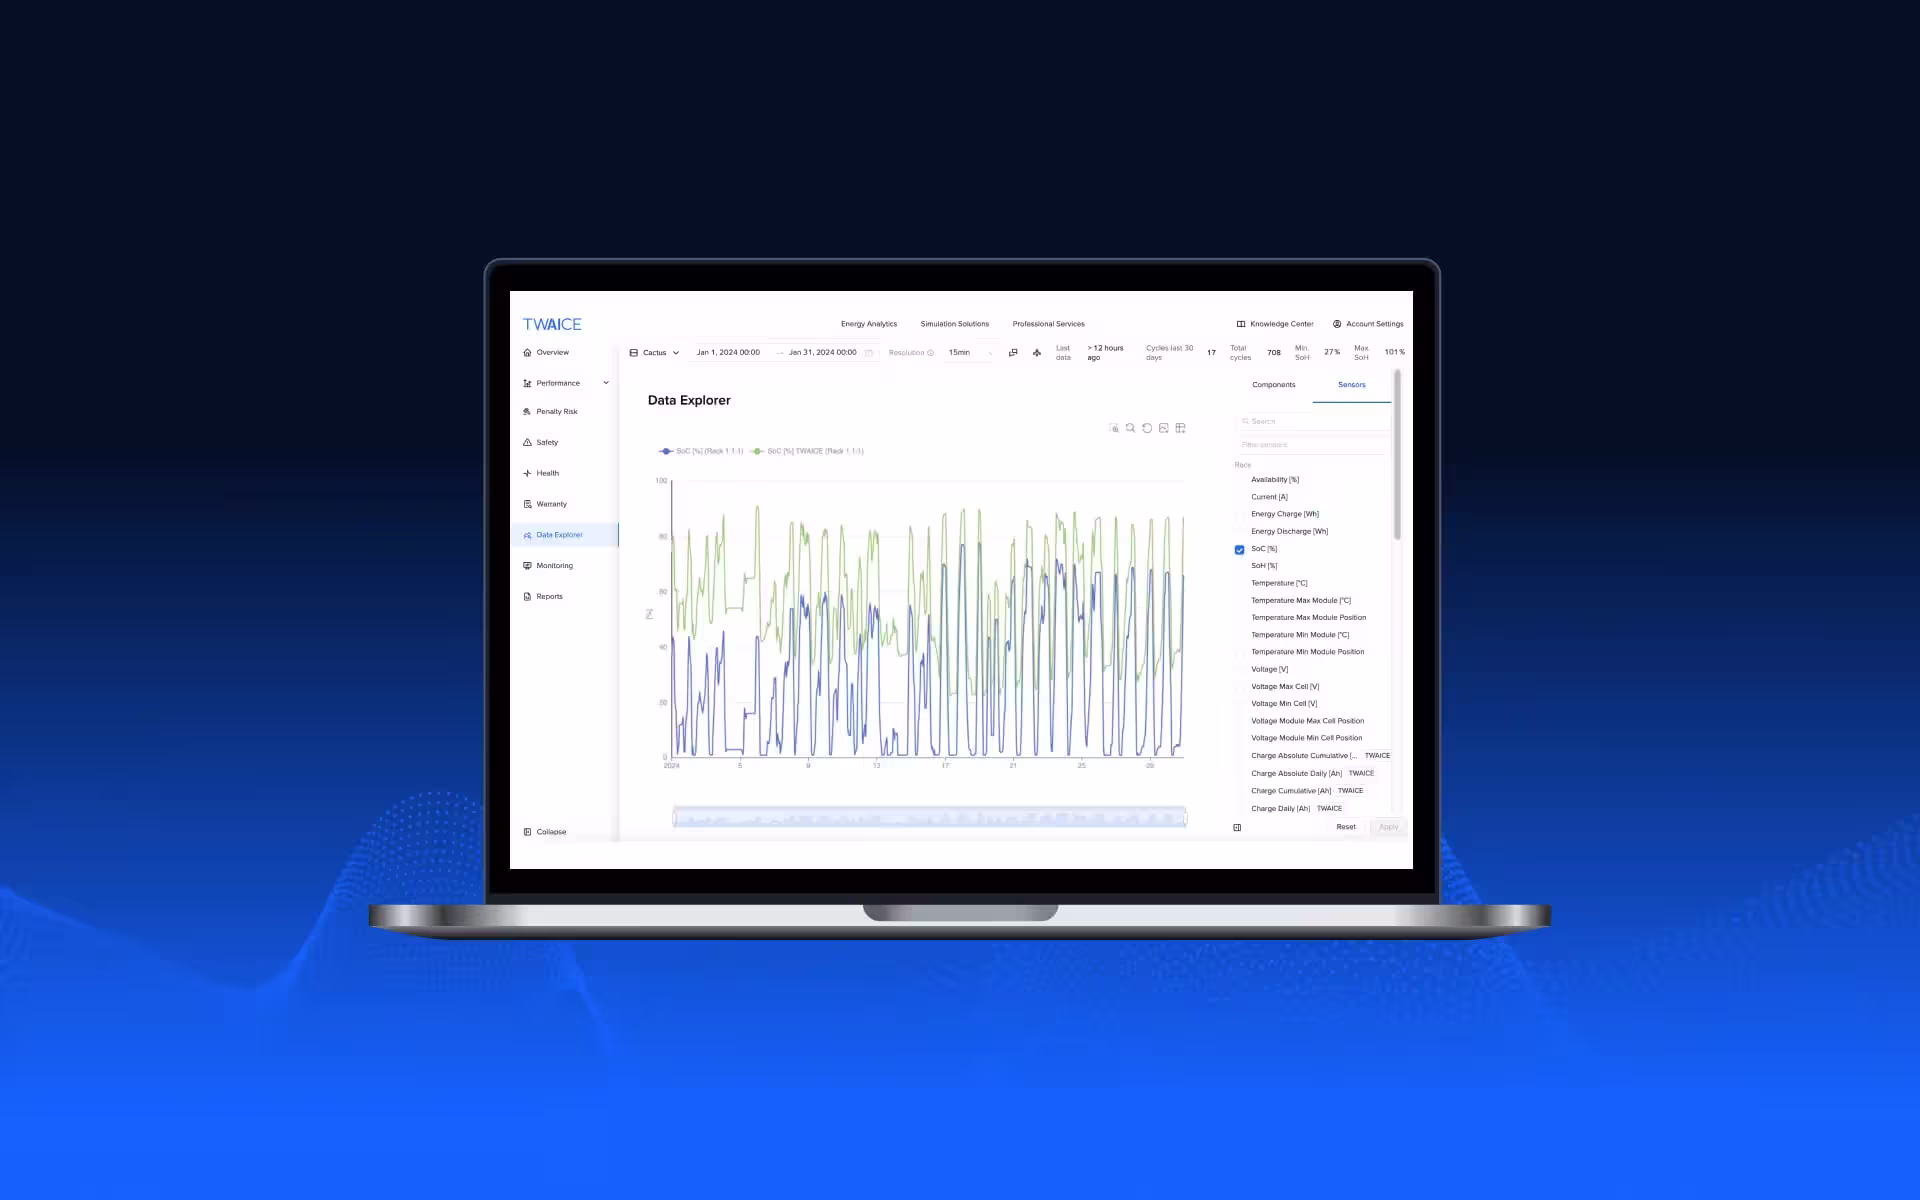
The TWAICE Data Explorer is a tool designed specifically for the volume and complexity of BESS data. Performance and operations engineers can:
- Instantly visualize time-series data from any sensor
- Quickly configure what’s displayed – no set-up, no code
- Speed up diagnosis and trouble-shooting
Traditional tools like Excel or Grafana are designed for generic data handling, not for high-density, high-frequency BESS signals. They are cumbersome to set up (i.e.,often requiring dedicated data teams), struggle to perform at scale, and don’t offer BESS-specific context. On the other hand, the TWAICE Data Explorer is built for ease and performance at scale. You can simply click any sensor or KPI to add it to the graph. It also allows for fast and easy re-configuration of signals on the graph, and can handle millions of datapoints daily.
Explore More Than Just Raw Signals
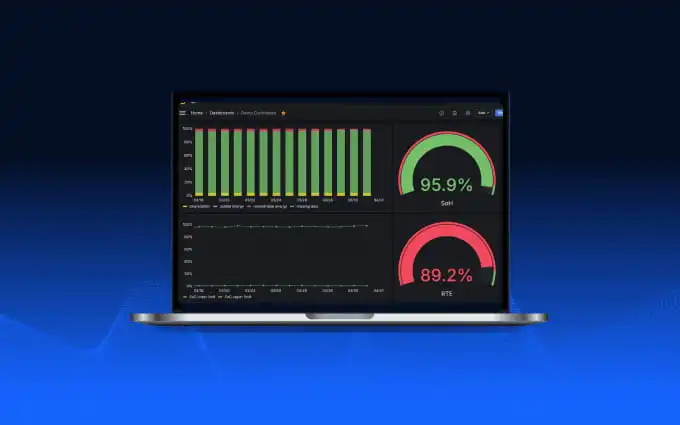
With most EMS or BMS tools, you get access to raw data like voltage or temperature. But those alone don’t tell the full story. That’s why TWAICE goes further by calculating advanced BESS KPIs such as voltage and temperature spreads, resistance and impedance trends, availability and usable energy, and lots more. With the Data Explorer, you can analyze these advanced metrics alongside raw time-series signals in a single view to get a complete picture of your battery system.
Access Historical Insights, Not Just Live Data
Unlike BMS or EMS platforms, TWAICE gives you access to historical data, not just live feeds. BMS and EMS tools are optimized for real-time monitoring and immediate control, but they typically lack user-friendly ways to explore historical data. With TWAICE, you can easily investigate events from the past and compare trends over time. This is crucial for spotting long-term performance degradation, validating warranty conditions, or understanding the evolution of an anomaly.
Examples
- Energy Storage Analytics flags anon-operating string – the Data Explorer helps you find out why. For example, you could easily look at all temperature and current sensors to see if there’s reason that would cause them to stop operating.
- Energy Storage Analytics indicates significant imbalances. With the Data Explorer, you can see the exact conditions under which the imbalances occur and then pinpoint which modules and/or cells within a rack are causing the imbalance.
- Comparing BMS SoC vs TWAICE SoC – this enables you to quantify the SoC errors and produce the evidence required to communicate the problem with the equipment provider by correlating other sensors like max and min voltage and current.
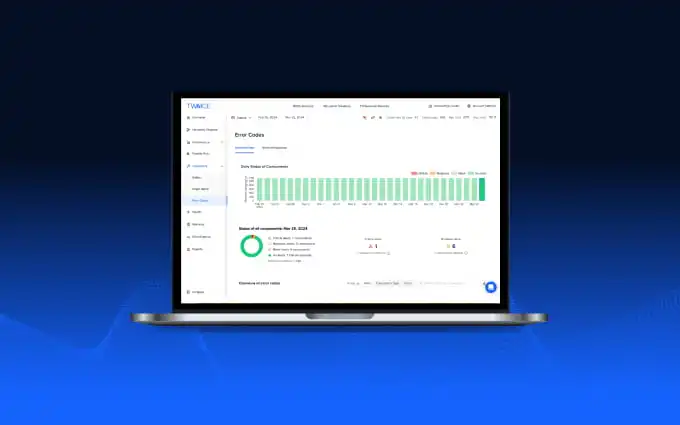
- Data outages are common, but determining when and why they happen is not always easy. A time-series view of the data makes it easy to see when an outage occurred and how severe it was.
- Alerts are helpful, but engineers often need time-series data to see the full picture. Visually comparing multiple sensors can make it easier to find the root cause.
Speed Up Data Analysis
Whether you’re investigating the root cause of a thermal anomaly, or validating warranty conditions, the TWAICE Data Explorer helps you get your answers faster.
Interested in learning more? Sign up for a weekly live demo.
Sign up for the next live group demo and learn how TWAICE can transform your BESS operations. In just 30 minutes, you’ll get a demo of key features and use cases, and engage with our product experts for a live Q&A.
.webp)