With BESS Hierarchy Diagram, operators can see where issues are happening, understand why, and take action—without switching tools or sifting through data.


%201%20(5).avif)


.avif)

Download the content

With BESS Hierarchy Diagram, operators can see where issues are happening, understand why, and take action—without switching tools or sifting through data.
TWAICE, a leader in BESS Analytics, today announced the launch of the BESS Hierarchy Diagram, a new feature for its Battery Storage Analytics platform that gives operators a real-time view of their entire battery system, helping teams act faster, plan smarter, and stay in control – without the need to juggle multiple tools or data sources.
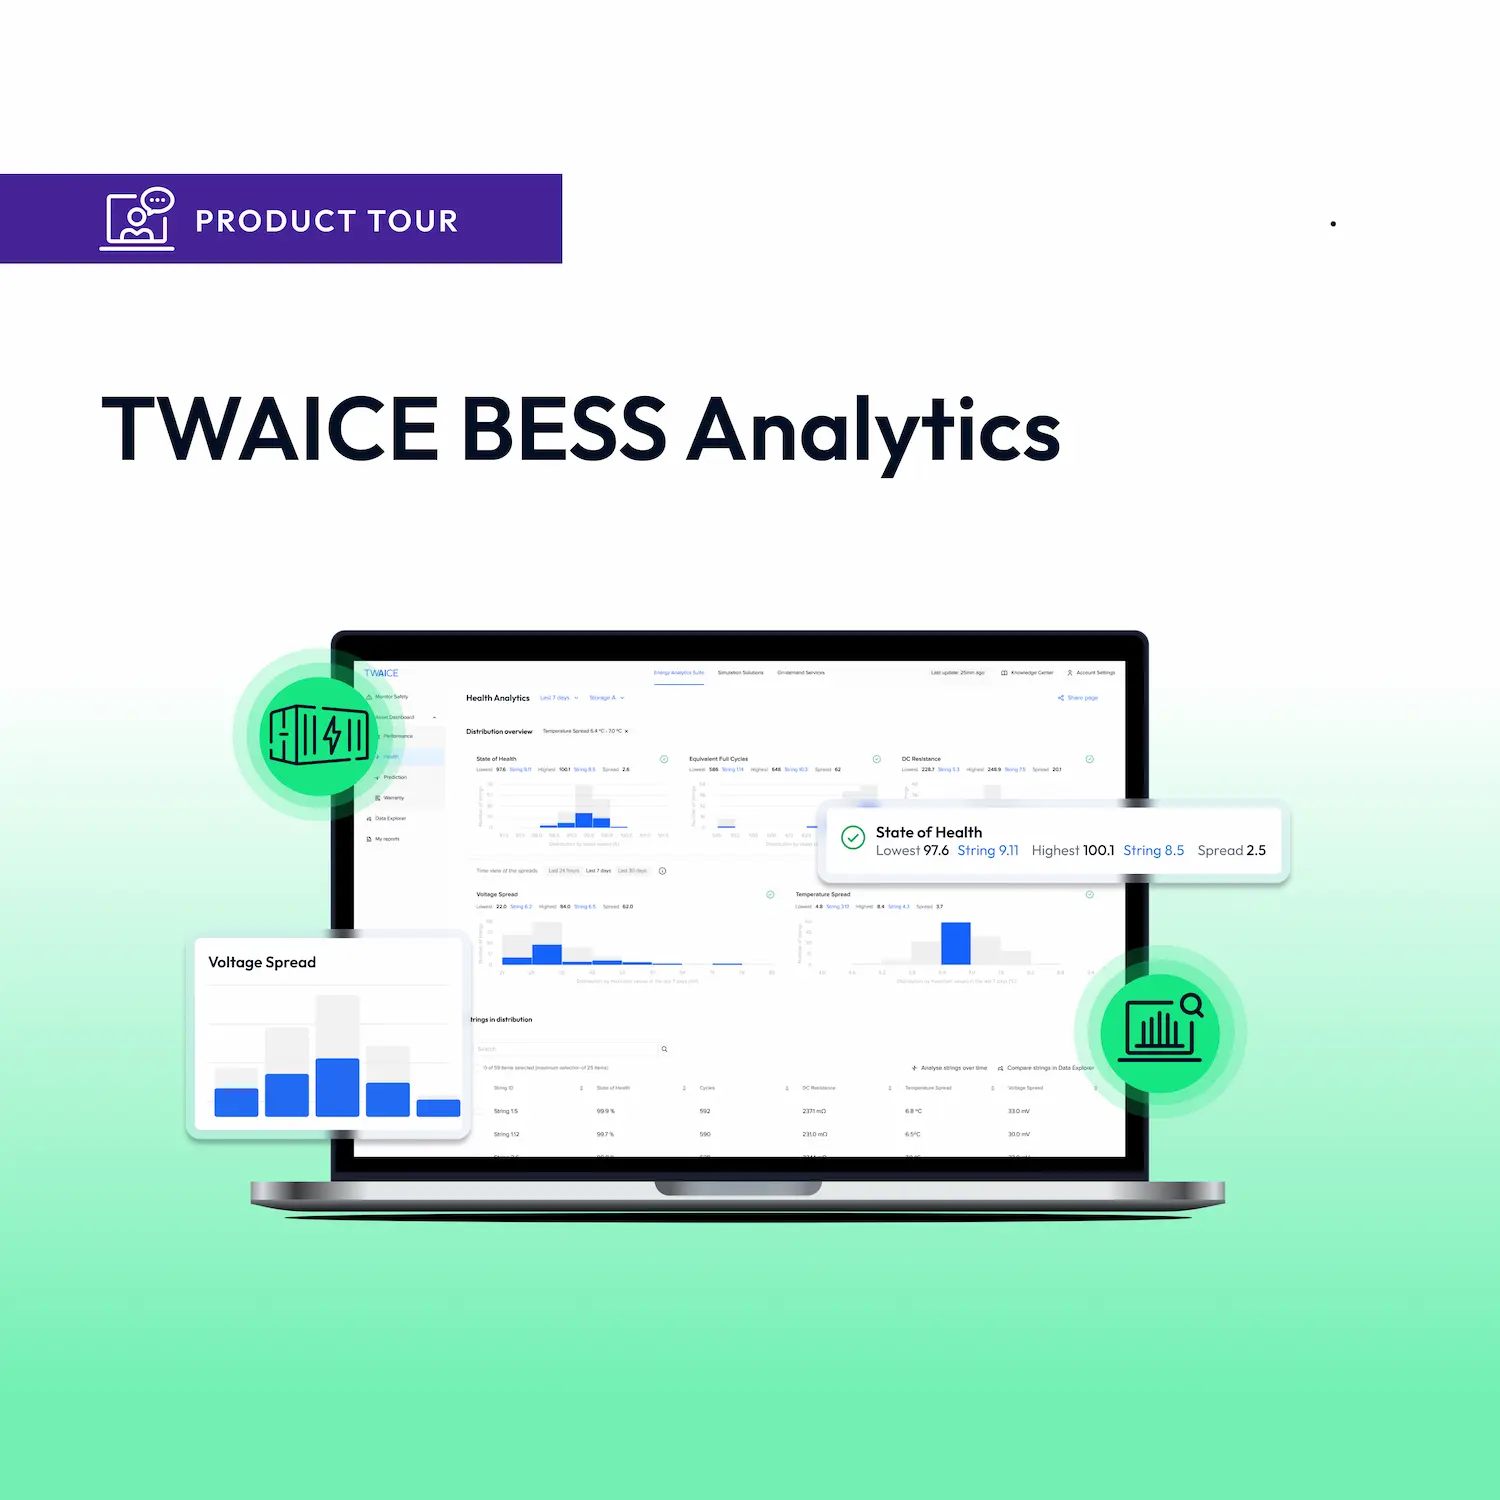
With this new feature, BESS owners and operators can see a live, logical map of their entire system – from PCS to container to module. Combining operational data, such as active power, throughput and PCS availability, the BESS Hierarchy Diagram offers a single intuitive, graphics-based interface that cuts down on manual, time-consuming data analysis.
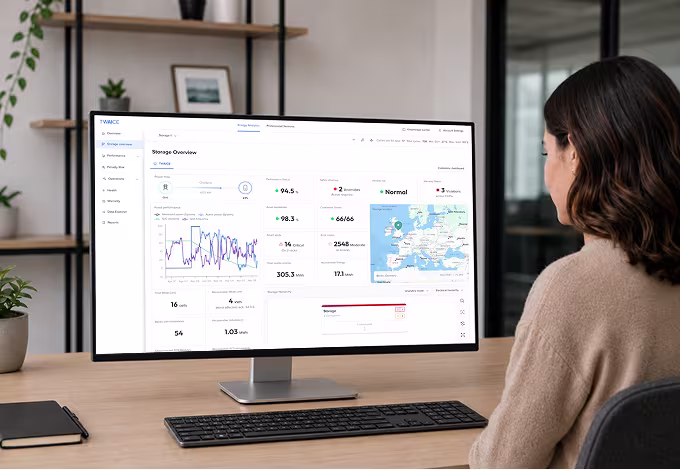
Battery energy storage systems generate billions of data points per day – far more than most teams can ever process. This information is scattered across fragmented tools and dashboards, making it challenging to answer even the most basic question: Is my system performing as expected?
Teams spend hours navigating volumes of data, stitching together insights just to get a clear picture of what is happening. The challenge of navigating data is especially pressing in an industry still ramping up its talent pipeline — where performance engineers, asset managers, and O&M teams are often tasked with doing more, with fewer specialized tools or experts on hand.
“I don’t want to click through numerous screens to download a CSV and then have to post-process it,” said Chris Swanson, Director Performance Engineering at Fullmark Energy. “I want to do a couple of clicks on a dashboard to get me what I need.”
Without intuitive tools, even well-resourced teams are left to piece together insights manually.
The new BESS Hierarchy Diagram gives operators a centralized view of their entire battery system. It shows live, operational KPIs such as charging and discharging status, power availability, PCS availability, BMS diagnostics, and active alerts all in one place. By consolidating critical data and alerts into a single visual interface, the BESS Hierarchy Diagram eliminates the need to check multiple tools, improves collaboration with on-site teams through a shared source of truth, and helps identify issues early for proactive maintenance planning.
“With the BESS Hierarchy Diagram, we’re giving operators the clarity they’ve been missing,” said Stephan Rohr, CEO at TWAICE. “Instead of chasing data across multiple tools, they can now see their entire system — structure, performance, and alerts — in one place. It’s a big step toward transforming battery storage operations from reactive firefighting to truly data-driven, proactive management.”
In addition to daily checks, teams can use the new feature to diagnose issues faster and act with greater confidence. They can remotely assess whether a site visit is needed, plan maintenance based on recurring issues, and significantly reduce the time spent on data analysis and troubleshooting.
TWAICE will showcase the BESS Hierarchy Diagram and its full suite of analytics solutions at RE+ 2025 in Las Vegas, September 9–12. Attendees can experience live demos, explore real-world use cases, and speak directly with product experts about how TWAICE is transforming BESS operations from the ground up.
To learn more, stop by Booth F17807 in Caesars Forum at RE+.
Watch this 5-minute video and learn how you can use TWAICE to transform your battery energy storage operations at scale.


.avif)
.avif)